Knowledge Sharing
PUBLIC FORUM AND HR CONGRESS
Each year, CHRSD holds a public forum addressing current HRM and organizational issues that draws immediate attention of employers and the general public. On these occasions, academics, business leaders, and government officials would be invited to share knowledge, experience, and insight on topics of mutual concern with the forum participants. On the other hand, HR Congress is an annual event that CHRSD has collaborated with CTgoodjobs since 2012. This annual event invites and gathers seasoned and well-known HR experts to share their advanced HRM knowledge, skills and tools with local HR practitioners.
ANNUAL PAY AND BENEFITS SURVEY
In 2023, CHRSD has developed the compensation strategy optimization engine, CSOE. It is an online platform that creates an individualized report for every survey participant. CSOE consists of four main functions: to fill in the survey, to view/download the report, self-assessment and effectiveness index. Self-assessment allows users to conduct a cross-firm, cross-industry and cross-region HR analysis according to their needs. The benchmarks include turnover, pay level, bonus, absenteeism, adjustment and fresh graduate salary. The effectiveness index integrates Bayesian statistics with our 30 years data collection results and over 50 years of scientific research findings. It is a set of individualized indicators that assess how well a certain pay level is effective in retaining talents compared to other firms.
To get a taste of our "AI Remuneration Consultant" function, we sincerely invite you to participate in our annual Pay and Benefit Survey in the coming July. The following are the procedures for participating in the survey:
1. At any time, scan the "Survey Registration" QR code to access the 2024 Guangdong-Hong Kong-Macao Greater Bay Area Pay and Benefits Survey registration form.
2. On July 2nd, you will receive a set of unique survey link, account user, and password for your private access to the dashboard.
3. From the beginning of October, you may download the standard survey report from your own dashboard.
4. We also sincerely invite you to join the "Guangdong-Hong Kong-Macao Greater Bay Area Pay and Benefits Survey Seminar" on October 24th.
5. Starting from October 24th, you may log into your dashboard to access the full set of "AI Remuneration Consultant" consulting service.
6. If you wish to gain a deeper understanding to our intelligent system, please contact us at chrsd@hkbu.edu.hk or (852) 3411 7404/3411 5227.
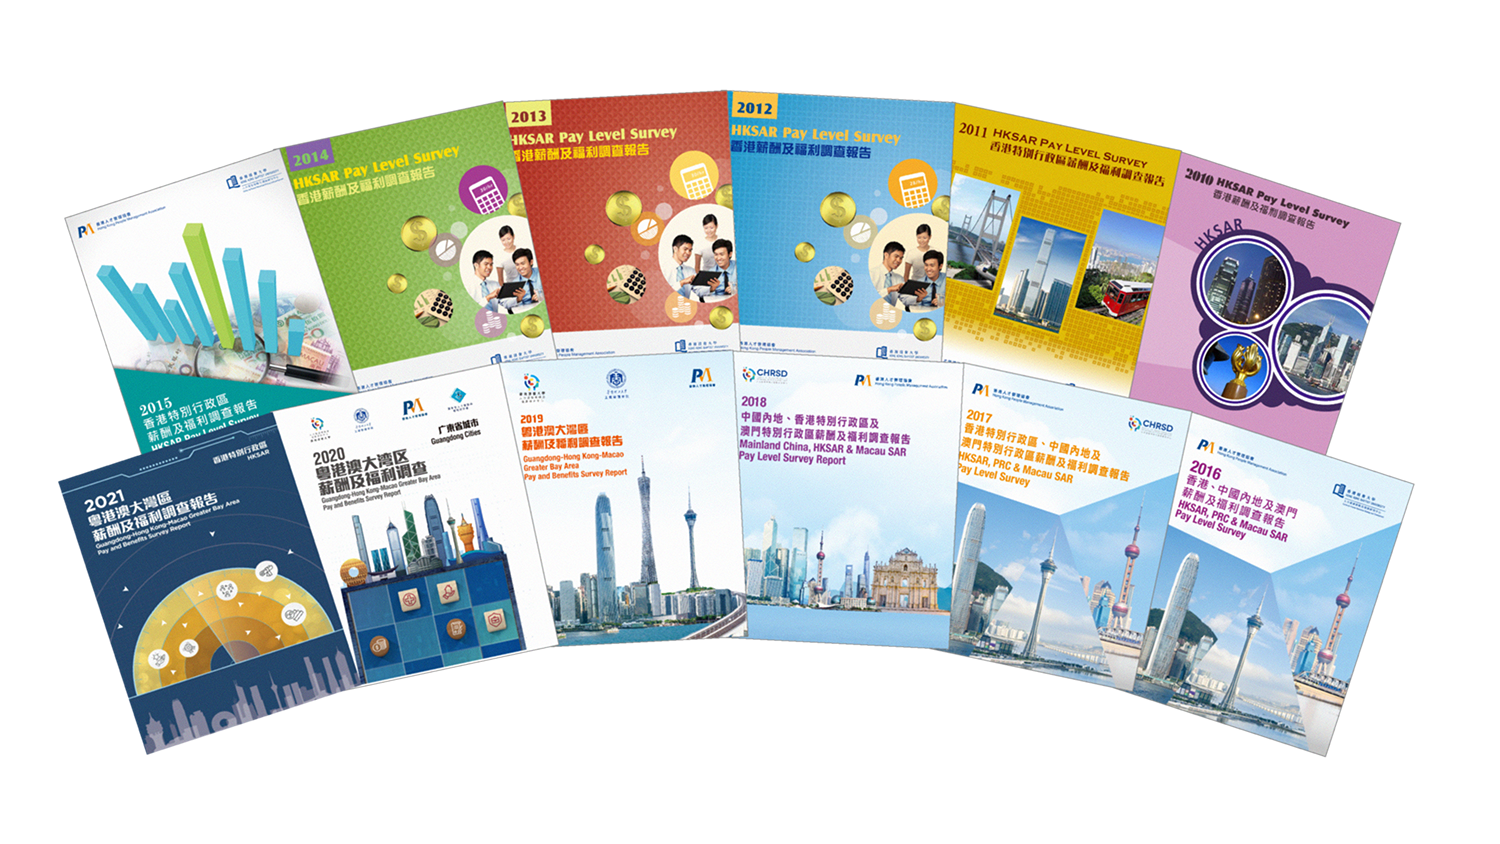
Hong Kong Baptist University and the Hong Kong People Management Association (HKPMA) has jointly conducted the pay and benefits survey annually since 1996. The South China University of Technology and Talent Development and Management Association of Guangdong have joined in 2019 and 2020 respectively. The targeted region of this survey is Guangdong-Hong Kong-Macao greater bay area, including the nine cities in the Guangdong Province, Hong Kong SAR and Macao SAR.
This survey aims to reveal the timely and updated information of pay and benefits provided by organizations from different sectors and cities in the surveyed regions. Major topics include salary adjustment, starting salary of fresh graduates, turnover rate, incentive schemes, employees’ benefits and cash compensation of around 300 surveyed positions, etc. From 2021 onward, we investigate the detailed cash compensation package of 15 key benchmarks jobs, aiming to establish a salary index.
| Year | 2017 | 2018 | 2019 | 2020 | 2021 | 2022 | 2023 |
|---|---|---|---|---|---|---|---|
| No. of participating organizations | 96 | 99 | 97 | 253 | 302 | 281 | 292 |
| No. of employees covered | 115,496 | 120.745 | 106,619 | 136,000 | 220,000 | 213,676 | 182,935 |
Our report reveals the updated pay and benefits, and human resources practices in different industries or cities investigated. Findings in this survey are references for organizations in human resources related decision making. Key results of the Hong Kong survey are shown in the tables below.
| Year | 2017 | 2018 | 2019 | 2020 | 2021 | 2022 | 2023 |
|---|---|---|---|---|---|---|---|
| Salary Adjustment (%) | 3.9% | 4.2% | 4.1% | 2.3% | 1.8% | 3.1% | 3.7% |
| Employee Turnover (%) | 26.4% | 28.4% | 19.4% | 13.5% | 18.0% | 18.6% | 21.0% |
Starting monthly salary for fresh graduates of bachelor degree
| Functional Areas | 2017 | 2018 | 2019 | 2020 | 2021 | 2022 | 2023 |
|---|---|---|---|---|---|---|---|
| Construction | 17,814 | / | / | / | / | / | / |
| Engineering | 14,699 | 15,924 | 17,010 | 16,825 | 17,206 | 18.495 | 20,950 |
| Production | 12,839 | 13,876 | 14,455 | 14,291 | 15,183 | 16,083 | 18,000 |
| Marketing | 13,350 | 14,086 | 14,578 | 14,676 | 14,819 | 16,936 | 17,262 |
| Sales | 13,257 | 13,367 | 13,376 | 13,846 | 14,429 | 17,249 | 18,900 |
| IT | 14,983 | 15,513 | 15,889 | 16,500 | 16,287 | 18,266 | 18,868 |
| Finance and Accounting | 13,400 | 14,156 | 14,673 | 15,413 | 15,604 | 17,144 | 17,670 |
| HR and Admin | 12,977 | 13,532 | 14,104 | 14,642 | 14,666 | 15,939 | 17,043 |
Timeline:
| Events | Period |
|---|---|
| Registration: | 1 June - 30 June |
| Completion of survey(s) by organizations: | 1 July - 31 July |
| Survey period: | from 1 July of the previous year to 30 June of the current year |
| Result Presentation & HR Seminar: | October |

